6 Minuten
A Historical Glance at Computational Music Analysis
From early pioneers in computer music, it was recognized that algorithms have the potential to both synthesize and analyze sound, which is manifested for instance in insightful writings by Otto Laske (Laske, 1981; 1991). Emerging from Laske’s circle of music engineering, techniques such as spectral analysis were used to break down complex sounds into their constituent frequencies. Those became fundamental in computational musicology since the development of digital signal processing (DSP) in the latter half of the 20th century, further democratized these tools, making it possible to extract a wide array of features from audio without the need for expensive lab equipment. This led to the development of python libraries like LibROSA (https://librosa.org/doc/latest/index.html), which provides a robust framework for audio analysis, and is also useful in instances where electroacoustic music is approached as an acousmatic work. The contemporary integration of large language models (LLMs) like Google's Gemini into the analysis of data obtained with tools like LibROSA, allows for not just data extraction but also for sophisticated, context-aware interpretation of musical phenomena.
SEMA – An attempt to automatize tedious data collection and interpretation
The main goal I had in mind writing the script for SEMA was to find a way to overcome the problem of spending days with a single audio file just to extract raw data for analysis. Being a professor at the Academy, I had to do this to help my own research and also to use it in classes with students, most of them without prior experience in such analysis. Since I needed to process a lot of music and sounds in a short time, I tried to design an assisting tool to perform the automated in-depth quantitative analysis of electroacoustic music, with a satisfying level of accuracy and usefulness. In general, SEMA leverages established audio processing techniques, and augments them with the interpretive power of artificial intelligence. I was inspired with several recent papers on the subject (see references section) to use similar methods, and to try to integrate them into one automated process using python and open-source tools instead of a specialized software such as MAX. I also used Gemini to help with coding and commenting the code, since it was intended for studying as well using.
Core Functionality:
Processing begins by loading .wav audio file and resampling it to a standardized sample rate (22050 Hz). This ensures consistency and optimizes performance for subsequent feature extraction. This is followed by the Feature extraction segment, where key sonic characteristics are quantified over time. The script extracts:
RMS Energy: Root Mean Square energy, a measure of the overall loudness or intensity of the sound.
Spectral Centroid: Represents the center of mass of the spectrum, offering an indicator of perceived brightness or sharpness of the sound. Higher values suggest a brighter timbre.
Spectral Roll-off: The frequency below which a specified percentage (e.g., 85%) of the total spectral energy lies. It is another indicator of the spectral shape and brightness, especially useful for distinguishing between pitched and noisy sounds.
Novelty Curve (Onset Strength Function): This feature highlights moments of significant sonic change or "newness," often correlating with the perception of onsets or attacks in the music. Peaks in the novelty curve suggest potential event boundaries.
Zero-Crossing Rate (ZCR): The rate at which the audio signal changes its sign (crosses zero). High ZCR values often indicate noisy, percussive, or chaotic sounds, while low ZCR values are characteristic of more tonal or sustained sounds.
Mel-Frequency Cepstral Coefficients (MFCCs): These are widely used in audio analysis to represent the timbral or textural qualities of a sound. The script extracts 13 MFCCs, providing a compact and perceptually relevant description of the sound's color.
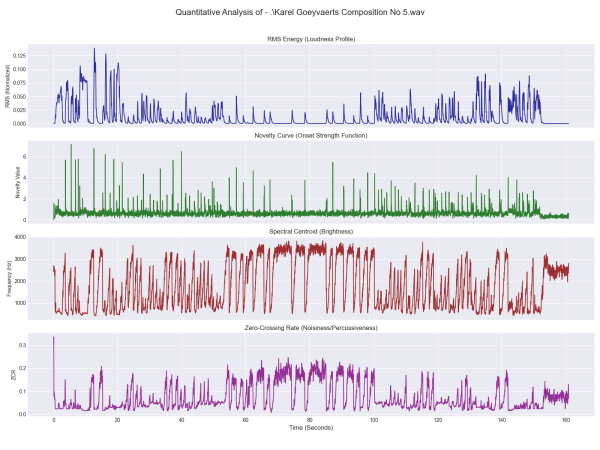
Example of plot results of analysis of Karel Goeyvaerts’ Composition No 5
Results and usage
All extracted features, along with a corresponding time vector, are organized into a Pandas DataFrame and saved as a CSV file. This structured format facilitates further analysis and visualization. So, I found it useful to generate plots for RMS Energy, Novelty Curve, Spectral Centroid, and Zero-Crossing Rate over time. These visualizations provide a quick, intuitive overview of the piece's dynamic, temporal, and timbral evolution. I also included a text report generated with the help of Google’s Gemini LLM, tasked to do narrative descriptions of the overall trends and characteristics for each extracted feature across the entire piece.
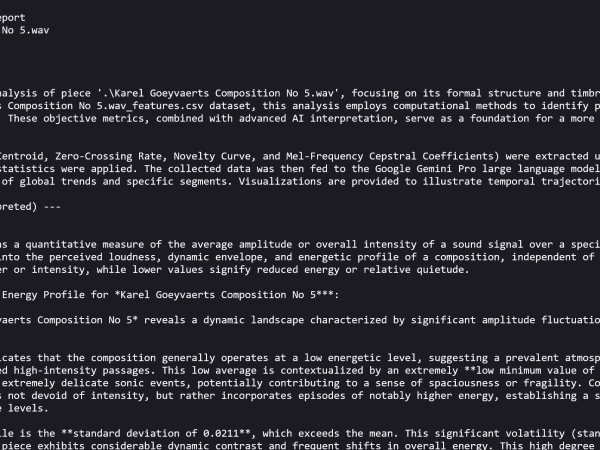
Read the full report: SEMA/Example output: Karel Goeyvaerts Composition No 5.wav_Analysis_Report_Gemini
By analyzing peaks in the novelty curve and significant changes in RMS energy, the tool suggests potential formal divisions or structural shifts within the composition. The user can also point out specific time segments, and the SEMA will generate a detailed interpretation of it, comparing its characteristics to the general trends of the piece. This allows for focused examination of distinct musical "moments" or particular sound segment, involving human experience into navigating through the entire piece of music.
When and where SEMA can assist?
SEMA offers a versatile set of capabilities, compiled having in mind real-world applications for musicians, musicologists, and researchers. Its main goal is to provide quantifiable data to support qualitative observations of electroacoustic pieces, especially those lacking traditional scores. So, it enables a systematic comparison of sonic characteristics across different pieces, composers, or stylistic periods. It can be used to assist in identifying and hypothesizing formal divisions and structural gestures based on objective sonic changes, for instance, how timbres transform and interact throughout a composition. Composers can also analyze their own works to gain objective feedback on dynamic shaping, timbral consistency, and formal clarity. Analyzing existing pieces (their own or others') can reveal underlying sonic patterns or transformations that inspire new compositional strategies or inform decisions about processing and arrangement.
SEMA is a practical tool for students to learn about audio features and their musicological significance. It allows students to directly apply computational methods to music analysis and observe the results and the code behind, with the possibility to modify it to better fit their needs. The extracted features and AI-generated descriptions can serve as rich metadata for archiving electroacoustic works, making them more searchable and understandable, and it is also fit for analyzing large collections of electroacoustic music in search for stylistic trends or common sonic characteristics. By combining audio feature extraction with context-aware interpretation, the SEMA empowers users to delve into the intricate sonic worlds of electroacoustic music, trying to bridge the gap between quantitative data and nuanced musical understanding.
Milan Milojković
Milan Milojković (1986) is an interdisciplinary researcher (PhD in Digital musical technology, Belgrade 2018) with over a decade of teaching and academic research experience in digital technology, music analysis, and human-computer interaction. Developing and analyzing sound-related computer tools, he implements results and achievements in his work at the Academy of Arts in Novi Sad (Serbia), and as a founding member of Laptop Ensemble Novi Sad. He regularly publishes articles about electroacoustic music and performs with LENS, applying theoretical findings in live concert musical practices.
Article topics
Article translations are machine translated and proofread.
Artikel von Milan Milojkovic
 Milan Milojkovic